A gameplay tracking app for Humans vs. Zombies tag
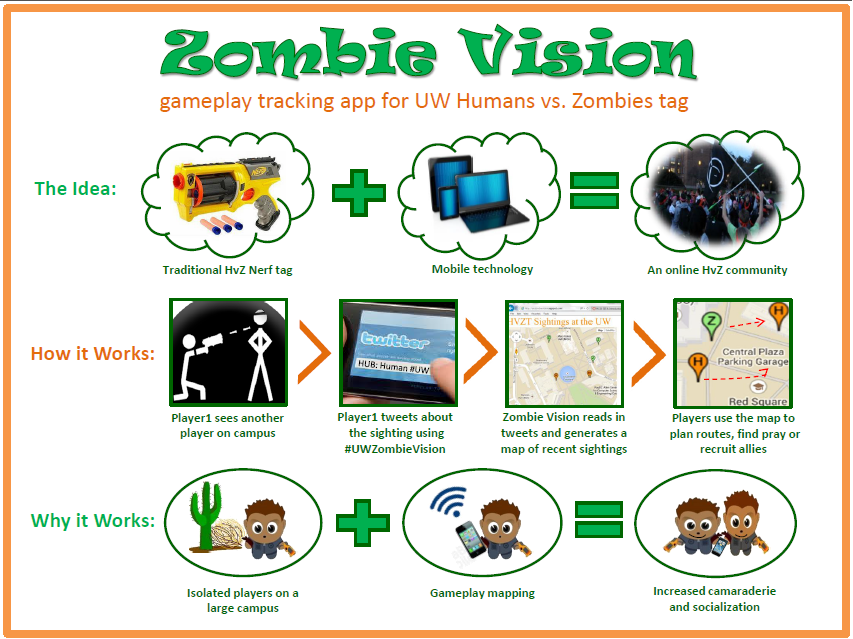
Project Poster:
Video Demo:
My Role: Zombie Vision is an ongoing personal project that stemmed from work done in an Interactive Systems Design And Technology class at the University of Washington. I have brainstormed, designed and programed Zombie Vision on my own and from scratch.
Development Details:
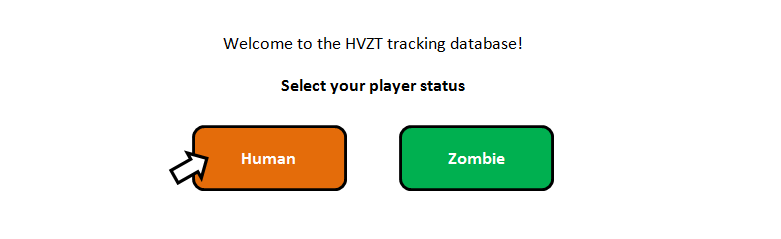
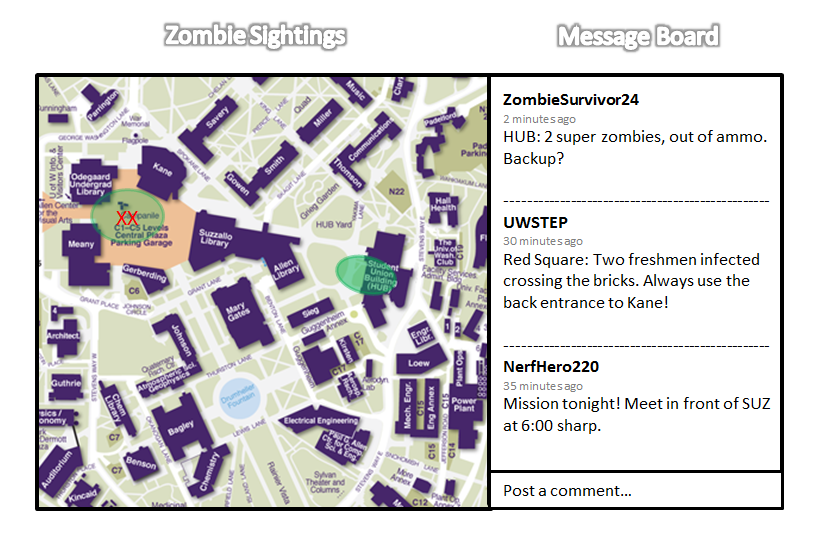
~Preliminary Sketches~
~Original Proposal~
Concept Title: Zombie Vision
Brief description: Human vs. Zombie tag tracking database (that game people play on campus with orange bandanas and Nerf guns every quarter)
Who will use it: HVZT players (at the University of Washington for now) who want to be more connected to the gameplay and other players.
What it does: Zombie Vision allows players to post and track zombie or human sightings across the UW campus on an interactive map. Locations posted directly or through designated twitter hash tags turn corresponding areas of a campus map orange for human sightings and green for zombie sightings. Additional information will appear on a side bar allowing players to provide detailed warning, call for backup or create team missions just for fun. Overall, Zombie Vision is intended to promote HVZT as a social activity, especially as surviving humans become scattered and few. Also, it’s just fun to get overly excited about a game and start keeping tactical logs like a secret agent.
What API(s):
- Twitter: Zombie vision will read in posts from #UWZombieVision as well as the time items were posted in order to update the gameplay map
- Google Map: Will supply the campus map for the web page (to be updated by player interaction)
Basic Steps:
- Player 1 posts “HUB: 2 super zombies stalking the Hub. Backup? #UWZombieVision” to twitter
- Zombie Vision reads in post
- If location and colon are in proper place at the beginning of the post, the HUB building on the campus map turns green.
- Player 1’s post is extracted and printed to the comment column on the Zombie Vision web page
- Every 2 minutes the webpage refreshes/ reads in new posts
- If a post is more than 10 minutes old the color indicator on the map fades
- If a post is more than 20 minutes old the color indicator disappears
~Resource Write-up: Google Maps~
Overview
Documentation for this API is comparatively clear and full of example code. It can be viewed at the developer’s home page: https://developers.google.com/maps
The Google Maps API can be used for web, IOS and Android applications and allows developers to create and embed interactive maps into their web pages using JavaScript or Flash interfaces. The API also provides complimentary services including Geocoding and Directions which return the XTML, VML, JSON and KML data formats. Ultimately, these tools make it possible to easily convert existing data into the latitude and longitude quadrants that are required to initialize a personalized map.
Directions
A call to “DirectionsService.route()” initializes a request to the Directions service. Origin and destination coordinates can then be provided for step by step directions following the provided documentation. Travel mode can be specified as driving, bicycling, walking or transit. Waypoints can also be added to the route.
Geocoding
As the documentation so eloquently puts it, “Geocoding is the process of converting addresses (like “1600 Amphitheatre Parkway, Mountain View, CA”) into geographic coordinates (like latitude 37.423021 and longitude -122.083739), which you can use to place markers or position the map.” This service can be accessed within your code using the “google.maps.Geocoder” object.
Creating a Map
Developers are able to customize nearly every feature of their map. One can “draw on the map” by adding markers, info windows, symbols or overlays. The type/style of the map can also be changed. The standard choices include roadmap, satellite hybrid and terrain. Each map can be given an initial zoom level and center point. However, unless otherwise specified, the map remains dynamic, allowing users to adjust or play with the image when they visit your webpage.
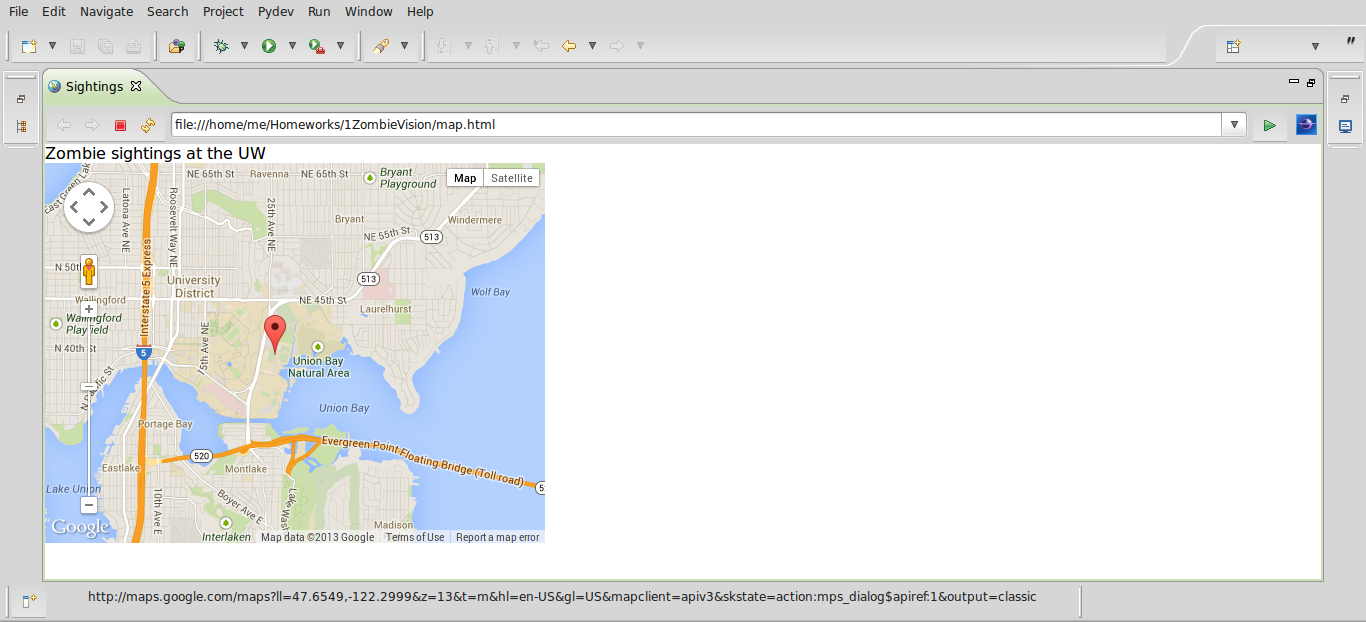
In case you still can’t picture what you are getting yourself into, here is some example code and output for creating a basic map of the UW with a single marker on the sports field:
Code
f = open(‘map.html’, ‘w’)
message = “””<!DOCTYPE html>
<html>
<body>Map of the UW
</body>
<head>
<meta name=”viewport” content=”initial-scale=1.0, user-scalable=no”>
<meta charset=”utf-8″>
<title>Map</title>
<style>
html, body, #map-canvas {
height: 100%;
margin: 0px;
padding: 0px
}
</style>
<script src=”https://maps.googleapis.com/maps/api/js?v=3.exp&sensor=false”></script>
<script>
function initialize() {
var myLatlng = new google.maps.LatLng(47.6549,-122.2999);
var mapOptions = {
zoom: 13,
center: myLatlng
}
var map = new google.maps.Map(document.getElementById(‘map-canvas’), mapOptions);
var image = ‘zombie.xcf’
var marker = new google.maps.Marker({
position: myLatlng,
map: map,
title: ‘Sports!’
});
var marker = new google.maps.Marker({
position: myLatlng,
map: map,
icon: image
});
}
google.maps.event.addDomListener(window, ‘load’, initialize);
</script>
</head>
<body>
<div id=”map-canvas” style=”width:500px;height:380px;”></div>
</body>
</html>”””
f.write(message)
f.close()
Output (map.html)
Tutorials
So far I have not run into trouble with this code for map generation, but if you are looking for additional tutorials a few resources are:
- The Google Developer’s Tutorial: https://developers.google.com/maps/tutorials/
- W3schools: http://www.w3schools.com/googleAPI/
Exemplar Applications
Many mashups use the Maps API and if you have the time and drive to parse through all of the pretty pictures you should visit the showcase section of the Google Developer’s web page at https://developers.google.com/maps/showcase/. A few of my favorite examples include:
- Runtastic: www.runtastic.com map your runs and track fitness goals using Runtastic’s GPS-enabled apps
- Converse Street Ready: www.thefwa.com/shortlist/converse-street-ready entertain yourself by dropping into a street view of London, Paris and Milan in search of a missing pair of sneakers.
- Foodspotting: www.foodspotting.com/iphone a guide to good food and where to get it
- FlightTrack: www.mobiata.com/apps/flighttrack real-time flight status from departure to destination
- Historypin: www.historypin.com compares historical photos with present day street view panoramas
